Evidence before action

The analyst that knows 1,000 stocks the way you know one.

Stop trading on gut feel. MworX screens the entire market overnight, explains every result in plain language, and keeps score on itself — wins and losses alike.

FILTER RESULTS — GRADED
SYMBOLP&LSCORE
AMD+ $1,240.00WIN
MPWR+ $862.00WIN
CVNY− $418.00LOSS
NVDA+ $1,590.00WIN
NET P&L + $0.00

Yes, that loss is supposed to be there. MworX shows you everything. That's the point.

Inside MworX

See it for yourself.

A complete desktop workspace, built by real traders and designed screen by screen. Here are five of its 131 — actual screens, not artist’s impressions.
MWORX — STOCK SCREENER RESULTS
A screener result explained section by section: criteria fit, market conditions, invalidation conditions, monitoring points
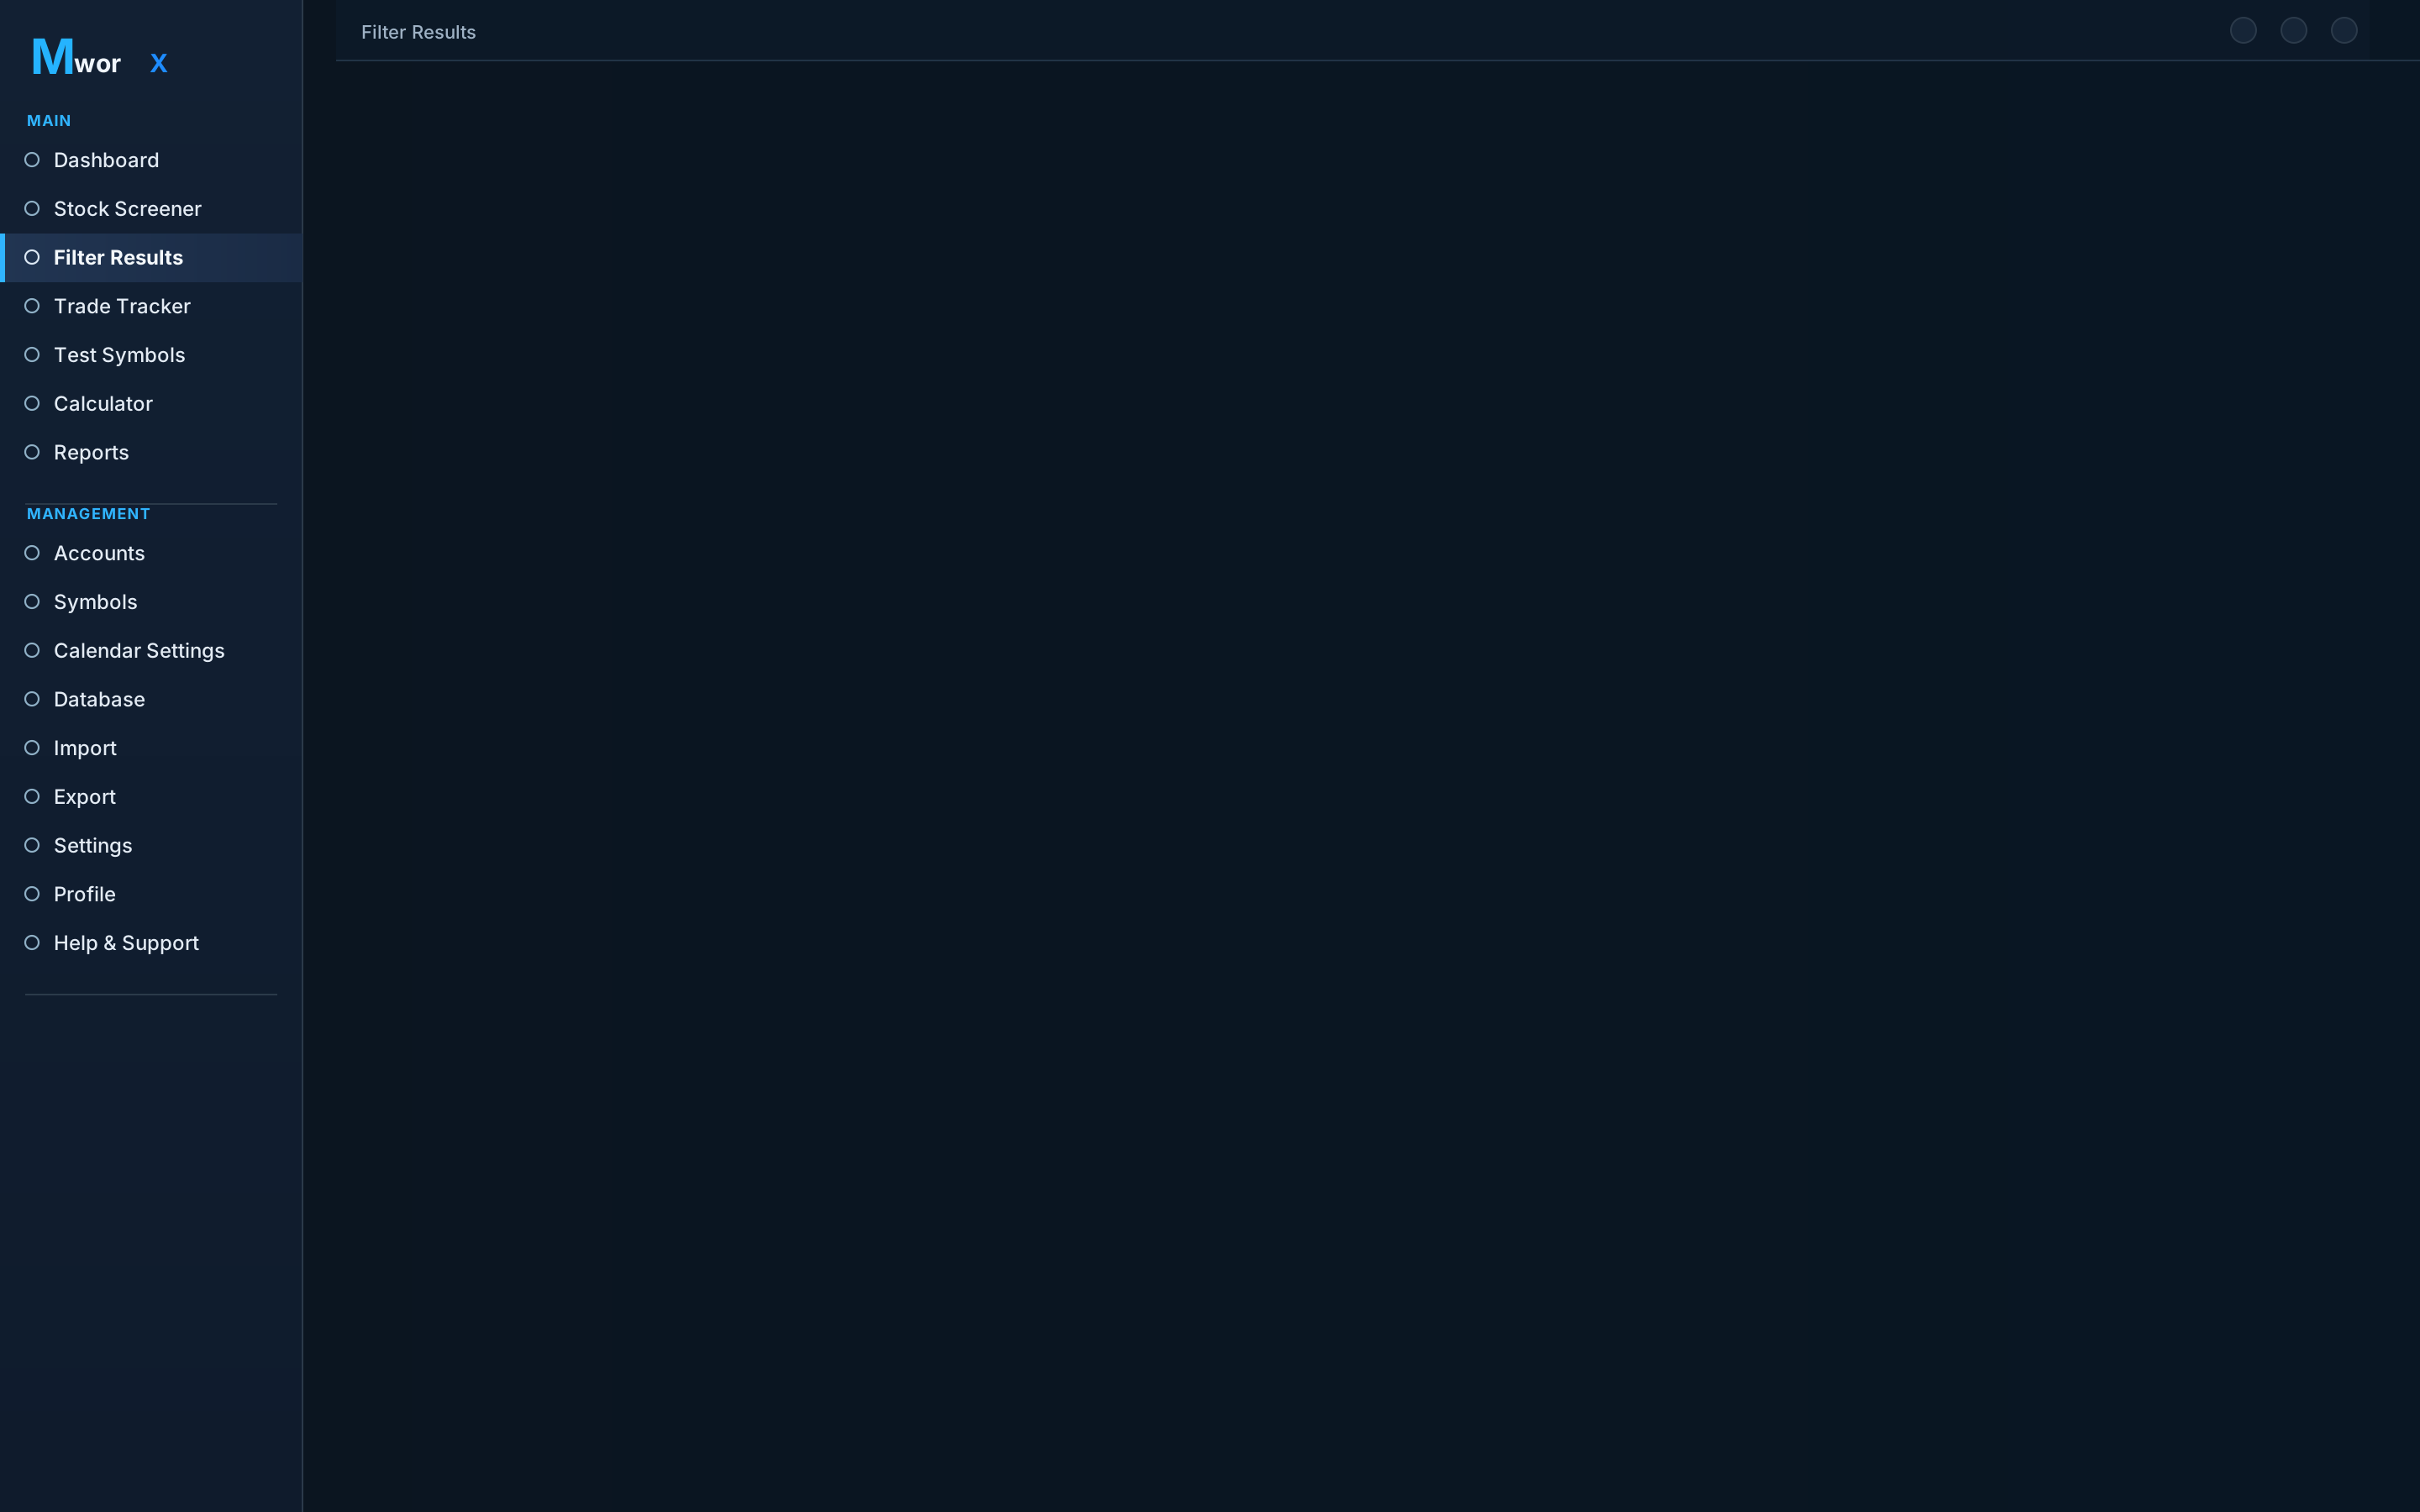
MWORX — FILTER RESULTS
Filter Results: the symbols that matched your search criteria, with the always-visible educational disclaimer
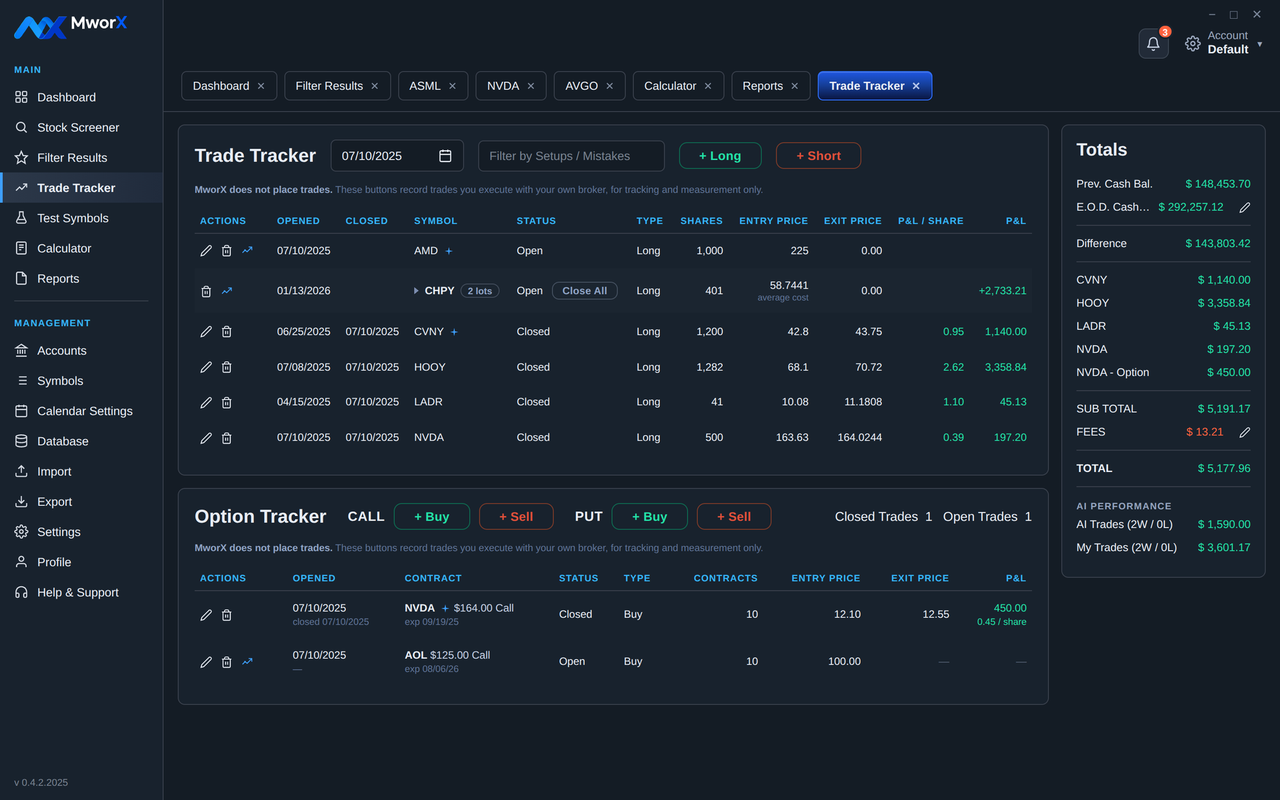
MWORX — TRADE TRACKER
The Trade Tracker: every position, lot, and outcome measured, with totals that reconcile
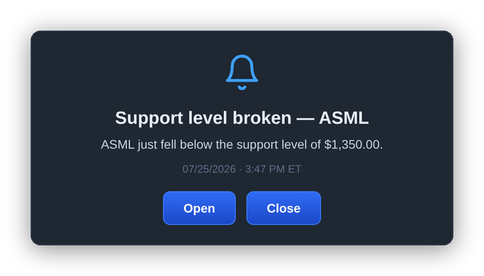
MWORX — MESSAGE CENTER
The alerts message center: every alert MworX has raised, in one place
MWORX — MONTHLY NET P&L WATERFALL
The monthly net P&L waterfall chart

Every screen you see is designed and specified — 131 of them, down to keyboard flow and empty states.

That screener result above — here's everything that ran before it reached the screen. The same checklist a professional walks, measured, scored, and written down.

12 examination areas 66 distinct measurements 7 scored categories 1 honest scoreboard

Trend & price structure

  • Trend direction — higher lows or lower highs
  • Price against the 50- and 200-day averages
  • Intact trend, or a broken one
  • Distance from the all-time and 52-week highs
  • Depth of the current pullback
  • Support and resistance zones — and how many times each has held
  • Long basing zones vs. short-lived shelves

Chart behavior

  • Chart patterns as they form
  • Candlestick behavior at the levels that matter
  • Where the move stalled — and on what
  • Gaps, rejections, and failed rallies

Momentum & volatility

  • Momentum state — washed-out and turning, or extended
  • MACD- and RSI-class indicators
  • Measured daily volatility (ATR)
  • Today's range against the stock's own norm
  • Whether volatility is building or draining

Volume & participation

  • Volume against the 20-day average
  • With-trend vs. against-trend volume
  • 30-day buy-side vs. sell-side trend
  • Estimated buying and selling pressure
  • Projected short-sale volume
  • Whether volume confirms the move — or calls its bluff

Fundamentals

  • Revenue and earnings trajectory
  • Margins
  • Debt load
  • Cash flow
  • Statements read from SEC filings directly
  • Every ratio computed in-house — never trusted from an aggregator

Valuation

  • Ratios against the stock's own history
  • Ratios against its sector
  • Where today's price sits in that picture

Institutional footprint

  • Institutional ownership level
  • Quarter-over-quarter ownership change
  • Insider activity over the trailing 90 days
  • Short interest
  • Days-to-cover

Market & sector context

  • What the index is doing — direction, magnitude, premarket behavior
  • The volatility environment
  • A market-regime tag stamped on every analysis
  • Sector momentum and strength
  • The move, decomposed: market, sector, company-specific, short-covering
  • Whether the day's tape helps the setup or fights it

Catalysts & events

  • Earnings dates — and whether one falls inside a contract's life
  • Post-earnings volatility behavior
  • Product and company events
  • Sector-wide waves
  • Contract expirations ahead

The stock's personality

  • How it behaves on big index down-days
  • How hard it rebounds
  • How deep its corrections typically run
  • How it reacts to its own earnings
  • Its normal daily noise vs. a real move
  • A $38 stock and a $1,375 stock don't move alike — each is measured on its own history

Options contract review

  • Delta bands appropriate to each leg
  • Expiration windows — roughly 30–45 days on sell legs, ~10–12 months on buys
  • Intrinsic vs. extrinsic content of the premium
  • Premium richness against that stock's own history
  • Open interest and real liquidity
  • Bid quality and spread sanity
  • Strike placement against real chart structure — not round-number habit
  • Earnings risk inside the contract window
  • Assignment awareness on short puts

The gates every result must pass

  • A stop level with reasoning attached — structure first, never a bare formula
  • An exit target, and the conditions that would invalidate the setup
  • Every criterion documented and readable inside the app
  • The rule above all of it: insufficient valid data beats guessing — no result rather than a padded one

How each level, range, and measurement is computed for a specific stock is proprietary to the MworX engine. What it found, and why it matched — that part you always get, in plain language.

And when the screening is done, Filter Results grades every match — ranked, scored, and waiting for your morning.
MWORX — FILTER RESULTS
Filter Results: every screener match graded and ranked, with scores and source pills
The dashboard

Your whole trading day, on one screen.

MWORX — DASHBOARD
The MworX dashboard: net P&L, win rate, open positions, charts, and trade tables in the slate interface

The real thing — not a mockup of a mockup. Every screen on this page is MworX.

Why MworX

It keeps score honestly.

Know the evidence. Know the risk. Know what changed. MworX grades every AI result to a final outcome — the ones you tracked and the ones you passed on — and shows you the whole record. If a trading tool won't show you its misses, ask yourself why.

  • Every result is graded. Win or loss, taken or skipped — nothing quietly disappears from the record.
  • Every match is explained. Criteria fit, invalidation conditions, monitoring points — the why is always on screen.
  • No black box — ever. MworX proposes the search criteria, you tune them to how you trade, and every one stays documented and readable.
AI Results Stats: every graded AI result with its final outcome — wins and losses in one report

The receipt. AI Results Stats grades every AI result to its final outcome — wins and losses, in the open.

The full tour

Measured from every angle.

Overnight screening, testing, open-position review, charts, dividends, statistics, and a full education library. Click any screen to zoom.

Test Symbols screen
Test before you tradeTry a trade as a test first. Tests never open positions on their own.
Open Positions report
Open positions, measured dailyTrade Health, MIF Score, and risk level for every open trade.
Open Positions Review
Open Positions ReviewA deeper look at each position: what's holding, what's changed.
Open Positions Why view
The why behind the numbersVolume analysis and the reasoning, spelled out in plain language.
Monthly P&L chart
Monthly P&LYour results month by month.
Compare previous years chart
Compare previous yearsThis year against the years before it.
Profit vs loss by month chart
Profit vs. loss by monthBoth sides of the ledger, side by side.
Dividend Tracker
Dividend TrackerEvery payment tracked, imported, and totaled.
Overall with dividends report
Trades + dividends, togetherYour complete P&L picture including dividend income.
Trade history totals
Totals per symbolLifetime P&L for every symbol you've traded.
Trade Statistics report
Trade StatisticsYour trading, quantified: win rate, profit factor, streaks, and more.
Symbols Analyzed report
Symbols AnalyzedEvery symbol you've analyzed, with its condition updated daily.
Scores report
Scores, side by sideYour own trades and trades tracked from AI results — both graded.
Monthly net P&L waterfall
The P&L waterfallHow each month builds — or dents — the running total.
Alerts

It watches while you live your life.

The market doesn't wait until you're at your desk — so MworX does the waiting. Streaming real-time quotes, nineteen distinct alert types, and every level that matters — entries, stops, targets, support — watched for you, all session long.

The MworX daily briefing screen
Your daily briefingEvery morning when you open MworX: today's and this week's events across your whole symbol list, overall market conditions, and an overnight evaluation of every open position and dividend holding.
A live alert popover over the MworX workspace
Live alerts, the moment it mattersReal-time monitoring raises the alert on screen the instant a watched level is reached.
The alerts screen
Nothing gets lostEvery alert lands in the message center — review it on your schedule, then clear it.
A day with MworX

The market keeps hours. MworX keeps all of them.

MworX works around the clock on every open-market trading day — like having your own assistant brief you each morning on market conditions and the state of every open trade, then stand watch until the close.

4:00 PM ET

The bell rings

Your trading day ends. MworX's shift begins.

Overnight

The homework

The engine screens the entire market against the documented criteria — every symbol, every category, while you sleep.

Pre-market

Your briefing

The morning briefing is waiting: market conditions, sector temperature, and where every open position stands.

The session

The watch

Nineteen distinct alert types guard your levels — entries, stops, targets, support — all day, every trading day.

After close

The grade

Every result is scored to its outcome. Wins and losses land on the record, and tomorrow's homework begins.

The education library

65 pages. Built to actually teach.

Most platforms hand you tools and wish you luck. MworX teaches the reasoning behind every screen — candlesticks, chart patterns, indicators, options, and the documented criteria the engine itself uses — so every session sharpens your trading decisions.

Candlestick field guide tutorial
The Candlestick Field GuideEvery pattern drawn to scale and explained — the anatomy of a candle, up days and down days, and what each shape signals.
Head and shoulders pattern tutorial
Chart patterns, explainedFrom head-and-shoulders to wedges — taught with animated figures.
MACD tutorial
Indicators without the mysteryMACD, RSI, moving averages, volume — each explained piece by piece.
Reading an options chain tutorial
Reading an options chainStrikes, marks, and Greeks — row by row, in plain language.
Search criteria documentation page
The criteria, documentedThe search criteria behind every result, written down where you can read them. Transparency is a feature.
Help & Support home
14.0.0
Help & Support home
Reading a Stock Chart
14.1.1
Reading a Stock Chart
Candlestick Field Guide
14.1.2
Candlestick Field Guide
Why MworX Uses Daily Candles
14.1.3
Why MworX Uses Daily Candles
Candlesticks at Support and Resistance
14.1.4
Candlesticks at Support and Resistance
Options Foundations & Implied Volatility
14.2.1
Options Foundations & Implied Volatility
Understanding How to Buy Calls
14.2.2
Understanding How to Buy Calls
Understanding How to Sell Calls
14.2.3
Understanding How to Sell Calls
Understanding How to Buy Puts
14.2.4
Understanding How to Buy Puts
Understanding How to Sell Puts
14.2.5
Understanding How to Sell Puts
How to Buy Stocks
14.2.6
How to Buy Stocks
How to Short Stocks
14.2.7
How to Short Stocks
Reading an Options Chain
14.2.8
Reading an Options Chain
Multi-Leg Strategies, Named
14.2.9
Multi-Leg Strategies, Named
How to Scalp Trade NASDAQ Tech Stocks
14.2.10
How to Scalp Trade NASDAQ Tech Stocks
Support & Resistance
14.3.1
Support & Resistance
Understanding Trend Lines
14.3.2
Understanding Trend Lines
Trend Structure: Higher Highs & Higher Lows
14.3.3
Trend Structure: Higher Highs & Higher Lows
How Chart Patterns Work
14.3.4
How Chart Patterns Work
Double Top and Double Bottom
14.3.5
Double Top and Double Bottom
Triple Top and Triple Bottom
14.3.6
Triple Top and Triple Bottom
Head and Shoulders (and Inverse)
14.3.7
Head and Shoulders (and Inverse)
Cup with Handle
14.3.8
Cup with Handle
Rounding Bottom
14.3.9
Rounding Bottom
Bump and Run Reversal
14.3.10
Bump and Run Reversal
Flags and Pennants
14.3.11
Flags and Pennants
Symmetrical Triangle
14.3.12
Symmetrical Triangle
Ascending Triangle
14.3.13
Ascending Triangle
Descending Triangle
14.3.14
Descending Triangle
Rectangle and Trading Ranges
14.3.15
Rectangle and Trading Ranges
Rising and Falling Wedges
14.3.16
Rising and Falling Wedges
Measured Moves
14.3.17
Measured Moves
Broadening, Diamond, and Island Reversal
14.3.18
Broadening, Diamond, and Island Reversal
Understanding Moving Averages
14.4.1
Understanding Moving Averages
Understanding MACD
14.4.2
Understanding MACD
Understanding RSI and Momentum
14.4.3
Understanding RSI and Momentum
Understanding Volume Charts and How to Interpret Them
14.4.4
Understanding Volume Charts and How to Interpret Them
Understanding a Stock's Trading Range
14.4.5
Understanding a Stock's Trading Range
ATR — the Method’s Ruler
14.4.6
ATR — the Method’s Ruler
Bollinger and the Band Families
14.4.7
Bollinger and the Band Families
Stochastic and the Momentum Dials
14.4.8
Stochastic and the Momentum Dials
The Indicator Cabinet
14.4.9
The Indicator Cabinet
MworX Search Criteria
14.5.1
MworX Search Criteria
The Managed Exit Target
14.5.2
The Managed Exit Target
Alerts and the Daily Clock
14.5.3
Alerts and the Daily Clock
Understanding P/E, Forward P/E & PEG
14.6.1
Understanding P/E, Forward P/E & PEG
Earnings, Dividends & Splits: How Events Move Stocks
14.6.2
Earnings, Dividends & Splits: How Events Move Stocks
The Market Day: Sessions, Opens & Gaps
14.6.3
The Market Day: Sessions, Opens & Gaps
Market Health at a Glance
14.6.4
Market Health at a Glance
Sector Rotation and the Business Cycle
14.6.5
Sector Rotation and the Business Cycle
The Yield Curve and Why Rates Move Stocks
14.6.6
The Yield Curve and Why Rates Move Stocks
Fundamental Analysis Basics
14.6.7
Fundamental Analysis Basics
Correlation and Diversification
14.6.8
Correlation and Diversification
Schools of Market Analysis
14.6.9
Schools of Market Analysis
Placing Your Trades: Order Types & the Bid/Ask
14.7.1
Placing Your Trades: Order Types & the Bid/Ask
Your Brokerage Account: Cash, Margin & Approval Levels
14.7.2
Your Brokerage Account: Cash, Margin & Approval Levels
Understanding Your Platform’s Terminology
14.7.3
Understanding Your Platform’s Terminology
The Trader's Discipline
14.8.1
The Trader's Discipline
Wisdom of the Old Hands
14.8.2
Wisdom of the Old Hands
Building Your Trading Journal
14.8.3
Building Your Trading Journal
How Does MworX Choose a Stop Loss?
14.8.4.1
How Does MworX Choose a Stop Loss?
Cutting Losses
14.8.4.2
Cutting Losses
Master Glossary
14.9.1
Master Glossary
How it works

Three steps. No mystery.

From first screen to graded outcome, you always know what MworX found, why it matched, and how it turned out.

STEP 01

Start with criteria that mean something

MworX proposes the search criteria — price, volume, technicals, fundamentals, options data — and you tune them to how you trade. Every criterion stays documented and readable, and the engine sharpens with every graded result.

STEP 02

MworX screens and explains

Symbols that match come back with the full picture: why it matched, what the market conditions were, and what would invalidate the setup.

STEP 03

Track it. MworX keeps score.

One click of Track records the trade you place with your own broker. From there, MworX watches it, alerts you, and grades the outcome.

MworX does not place trades. It records trades you execute with your own broker, for tracking and measurement only.

Features

Built like it means it.

Screener, tracker, alerts, reports, and a full education library — one application, every angle covered, one honest scoreboard. No tab-juggling between six subscriptions.

Your data lives on your desktop.

Nearly every trading tool today is a web platform — your trades, your P&L, your notes parked in someone else's cloud, one breach away from being someone else's problem. MworX is a desktop application: your trading data stays on your machine, where it belongs.

An honest scoreboard

Win rates built on real outcomes, losses included. Trade history, P&L charts, dividends, calendars, and statistics — your whole record, measured.

It watches like a bodyguard

Nineteen distinct alerts across six types — including a two-stage stop alert — keep eyes on your positions so you don't have to stare at a screen all day.

Eight calculators, zero spreadsheets

Long and short exit estimates, investment sizing, daily margin cost, cost basis after averaging up or down, break-even after an average, future dividend income, and quick math — the working numbers, one click away.

One click to Track

Found something worth acting on? Track it in seconds. MworX pre-fills the details, records your trade, and starts watching immediately.

It teaches while it works

A 65-page education library — candlestick patterns, trend lines, strategies, and terms — wired directly into your results screens, one click from the data.

Everything in one place

Screener, filter results, trade tracker, calculator, dividend tracker, reports, alerts, and settings — a complete desktop workspace designed screen by screen, so every number you need lives one click away.

One application. The whole job.

The usual stack
  • A screener subscription
  • A charting platform
  • A separate trade journal
  • An alerts service
  • An options course
Five logins. Five bills. Zero shared context.
MworX
  • Screener, tracker, alerts, and reports in one workspace
  • A 65-page education library built in
  • One honest scoreboard across all of it
  • Everything reads the same data
One desktop application. Your machine.
0
Designed screens
0
Pages of education
0
Distinct alerts
0
Honest scoreboard
From the people who built it

We started where you started.

The traders behind MworX began the way most people do — wanting to manage their own investments, and knowing nothing. We studied. We paid for our lessons the expensive way. And somewhere along that road, we realized the tool we wanted didn't exist: one place that does the homework, explains its reasoning in plain language, keeps honest score, and teaches as you go — so nobody has to walk the learning road alone.

MworX is that travel companion — sound, well-thought-out information, clear reasoning, and a record that includes the misses. An assistant you can count on.

— The traders behind MworX
Questions

Straight answers.

What is MworX?

MworX is a desktop trading workspace for US stocks and options that works in the background every day the market is open. Around the clock, it screens your symbol list against documented search criteria built by real traders — and every morning your Top 10 Results are waiting: stock, ETF, and option setups, each explained in plain language. Before you act, run any trade through the same analysis and see its full statistical case. Then MworX keeps the record: wins and losses with complete trade history, P&L by symbol and by account, dividends tracked alongside trading income for the full picture, and day-by-day, month-over-month charts that show whether you're actually improving — a little competition with yourself, built in. Eight calculators handle the working math, from position sizing and cost basis to margin cost and future dividend income, and a 65-page education library teaches the concepts behind every screen.

Does MworX place trades or tell me what to buy?

MworX doesn't place or route orders — every trade decision stays yours. What it hands you is the homework professional traders do before they ever place a trade: trend structure, support and resistance graded by strength, momentum and measured volatility, volume and buying-versus-selling pressure, fundamentals straight from SEC filings, institutional ownership and insider activity, short interest, sector strength, market conditions, and the earnings calendar — dozens of measurements across seven scored categories, every result explained in plain language and graded to its final outcome. And on the roadmap: a broker integration that auto-imports your open and closed trades. See the full list of what MworX examines →

How does the AI screening work?

Each evening after the market closes, MworX analyzes your symbol list against the search criteria. Every result arrives with its reasoning attached — what matched, what the market was doing, and what would make the result less relevant. AI can be wrong, which is why every result is also graded to its final outcome on the AI Results Stats report.

Can I change or build my own search criteria?

No. MworX was engineered by professional traders. It already runs the same checklist a professional walks — 12 examination areas, 66 distinct measurements, and 7 scored categories — measured, scored, and written down for every result. The system is designed so you do not need to be an expert at building filters. The criteria deliver the highest-quality setups possible; your Top 10 Results every morning reflect that professional-grade analysis.

Does MworX use real-time data or only end-of-day?

MworX uses real-time streaming data feeds. During market hours it continuously screens your symbol list and monitors every open position on a candle-by-candle basis. Built-in alerts notify you of trend-line breaks, chart-pattern developments, moving-average crosses, RSI shifts, and volume changes as they occur. The formal Top 10 Results and full statistical grading are still produced after the close so the analysis includes the complete day’s price action, volume, and institutional activity.

What does the education library cover?

65 tutorial pages: reading stock charts, candlestick patterns, support and resistance, options foundations, buying and selling calls and puts, chart patterns like head and shoulders, MACD and other indicators, and a full glossary. The library ships inside MworX with the Beta version.

What does MworX track?

Open positions with daily measurements, a Trade Tracker with typed entry for stocks and options, dividends imported and totaled, complete P&L reporting by month and by symbol, and trade statistics — win rate, profit factor, and streaks. Nineteen distinct alert types watch your levels while you live your life.

Does it handle options well?

Yes. The Stock Screener, Trade Tracker, calculators, and education library all cover stock, ETF, and option setups. You can analyze calls, puts, and multi-leg strategies with the same graded measurements used for shares. A dedicated Options contract review examines delta bands appropriate to each leg, expiration windows, intrinsic vs. extrinsic content of the premium, premium richness against the stock’s own history, open interest and real liquidity, bid quality and spread sanity, strike placement against real chart structure, earnings risk inside the contract window, and assignment awareness on short puts. Position-sizing and margin calculators are built for options.

Will MworX work with my broker?

MworX never places or routes orders — every trade decision stays yours. On the roadmap is broker integration that will auto-import your open and closed trades, dividends, and other related data so the Trade Tracker, P&L, and statistics stay accurate without manual entry. Until that ships, you can enter trades manually in a few seconds.

Is my financial data private?

Yes. MworX is a desktop application that runs on your machine. Your trades, positions, quantities, prices, profit and loss, and personal notes stay on your own computer. None of it is sent to us, and there is no cloud account required for the core features.

How is MworX different from other screeners or platforms?

Most screeners give you a list of tickers that match filters. MworX gives you the full case for each result: why it matched, what the market was doing at the time, the graded strength of the setup across seven categories, and what would make the result less relevant. It then tracks every trade you take against those same measurements so you can see, over time, whether the setups that look good on paper are actually improving your results. It is designed for the work that happens before and after the trade — systematic professional-grade analysis, complete journaling, and measurable self-improvement — all inside one focused workspace.

What are the system requirements?

MworX is a desktop application for Windows and macOS, currently in development with a Beta version on the way. Exact minimum requirements will be published with the Beta. The design goal is to run cleanly on a typical trading machine without needing high-end hardware. Mobile, iPad and tablet versions are planned.

How do I get MworX?

MworX is a desktop application for Windows and macOS, currently in development with a Beta version on the way. Use Claim a seat to sign up for the Beta test group.

The Beta group

We’re taking fifty.

MworX opens to fifty Beta testers. Not five thousand. Small enough that we know who you are, and small enough that what you tell us actually changes the build.

This isn’t a mailing list. You’ll be on the calls.

Regular conference calls

With one of our traders, not a support queue.

Live screen shares

Screen to screen — discussing what’s working, and sharing ideas for improvement.

Real influence

Features get built, reshaped, or dropped based on what this group says. That window closes when the group does.

First hands on everything

Every screen, every tool, before anyone else sees it.

The next phase after the Beta test period is general release. General release is a finished product.

Fifty seats. That’s the whole Beta.

You’ll be on the calls and the screen shares — and what you say changes what gets built. Then it ships as a finished product.

Claim a seat →
Click to close